FIG. 02.3 — Project notes
- Independent
- Finished
PANDEMICA: Computational Epidemiology & Outbreak Modelling
A Python platform that models how an infectious disease spreads — deterministic, stochastic, network and spatial models — fitted to real outbreak data, with a live Streamlit dashboard.
Educational only — not a forecasting tool
Simplified textbook models built for learning. They are not forecasting tools and make no public-health, clinical or policy claims.
- Fitted R0, 1978 flu outbreak
- 3.93
- Extinction: simulated vs theory
- 0.17 vs 0.16
- Attack rate, targeted vs random vaccination
- 2.8% vs 58.8%

01Problem
Epidemic models are usually met one at a time. PANDEMICA puts four approaches side by side — deterministic (ODEs), stochastic (Gillespie), network (agent-based) and spatial (metapopulation) — fits them to real public surveillance data, and checks them against known analytical results.
02Question
How does an infectious disease spread, and how does the choice of model change the answer?
03Data
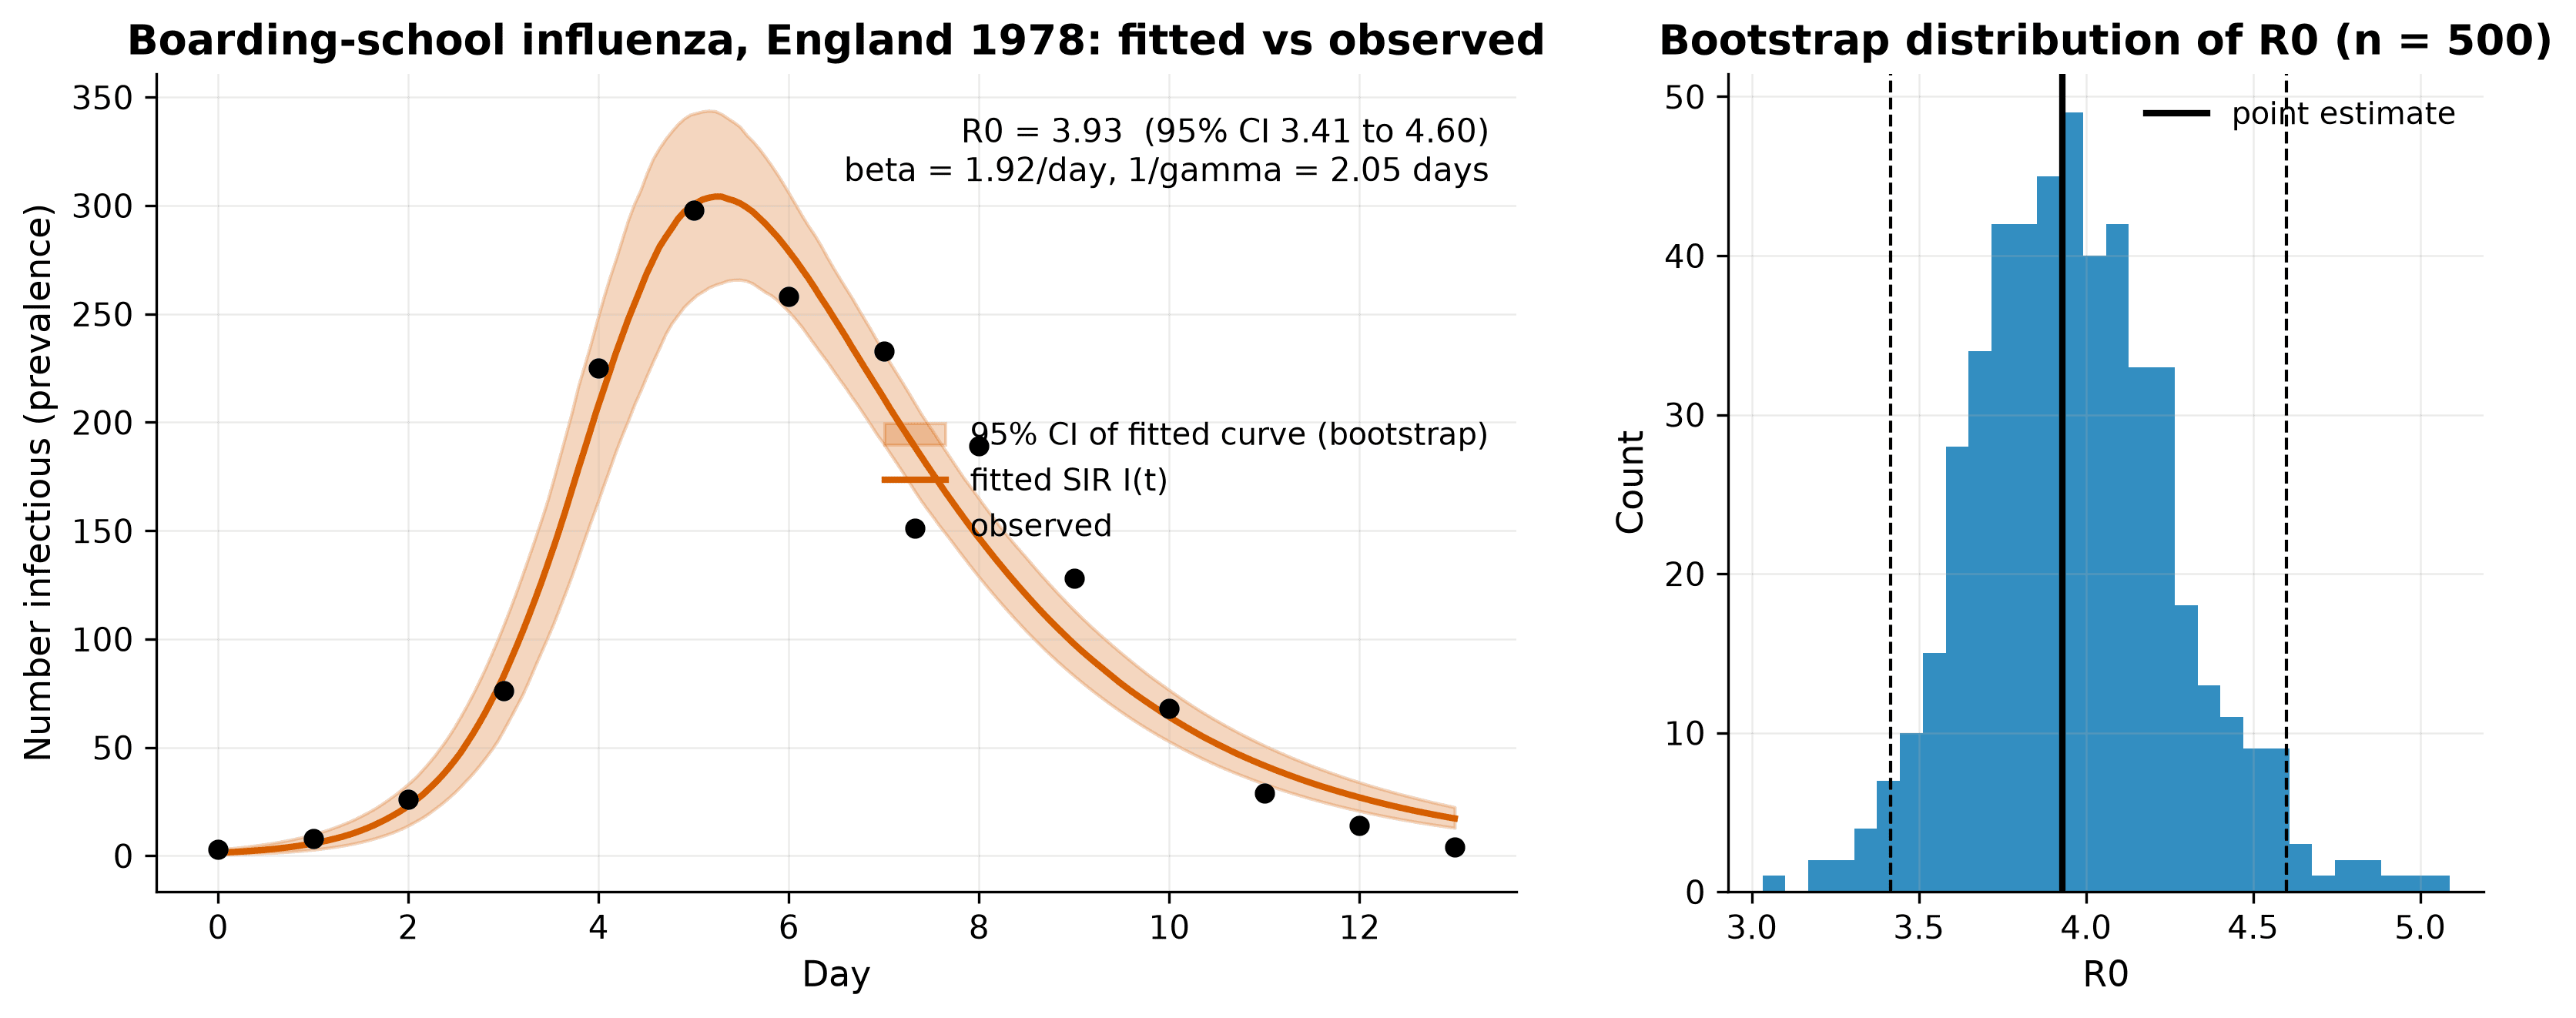
The 1978 boarding-school influenza outbreak (England) and early COVID-19 case counts from JHU CSSE (a method demonstration only), plus synthetic datasets with known parameters for validation.
04Methods
- M1 Compartmental: SIR / SEIR / SEIRD ODEs with solve_ivp, optional vaccination, waning immunity and isolation.
- M2 Fitting: least squares on square-root counts with residual-bootstrap confidence intervals, plus parameter-recovery and CI-coverage checks on synthetic data.
- M3 Stochastic: exact Gillespie simulation, with early-extinction probability compared against branching-process theory.
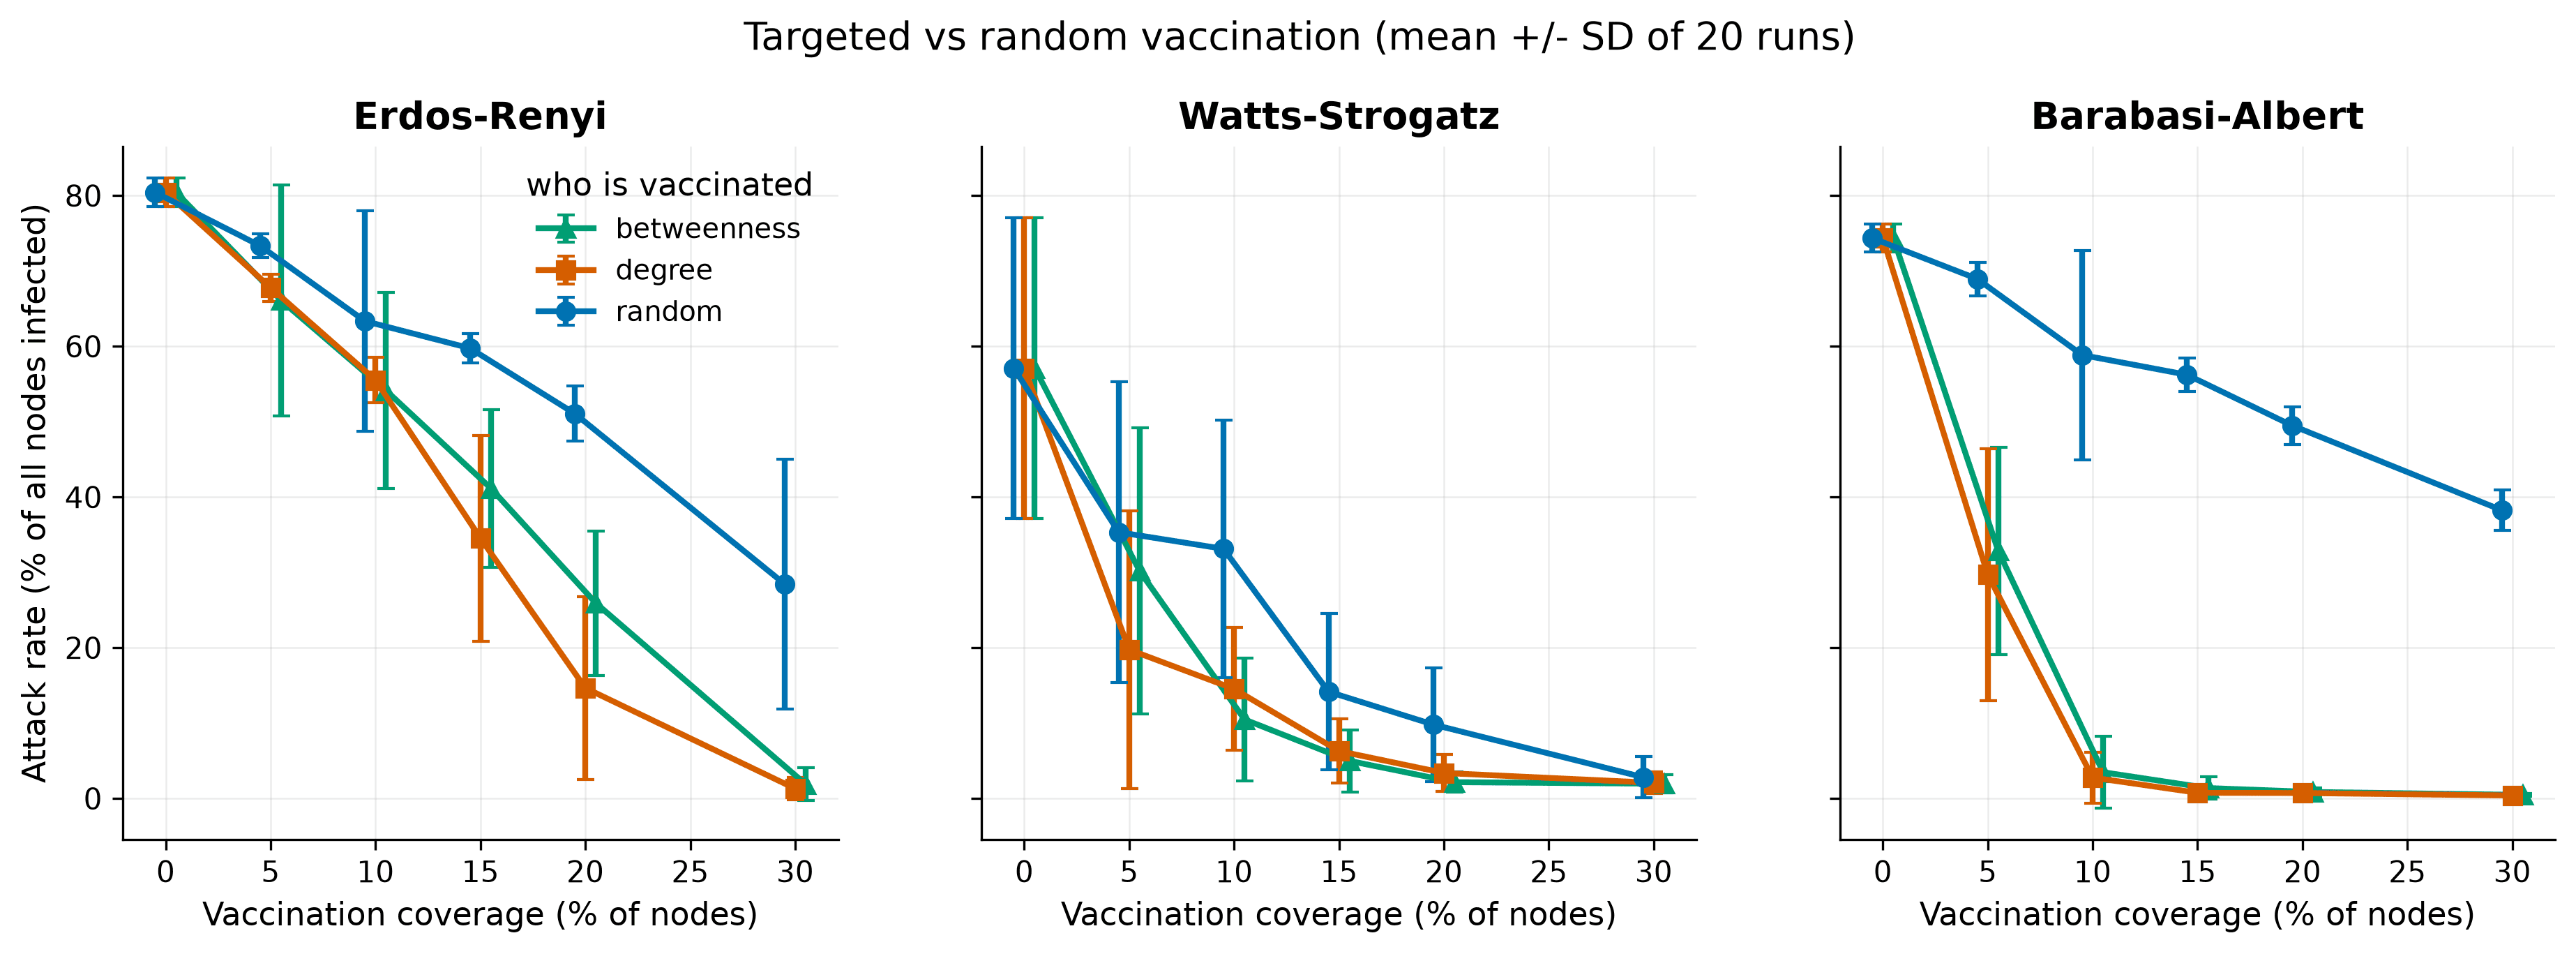
- M4 Network: Erdős–Rényi, Watts–Strogatz and Barabási–Albert networks (NetworkX), superspreaders and targeted vaccination.
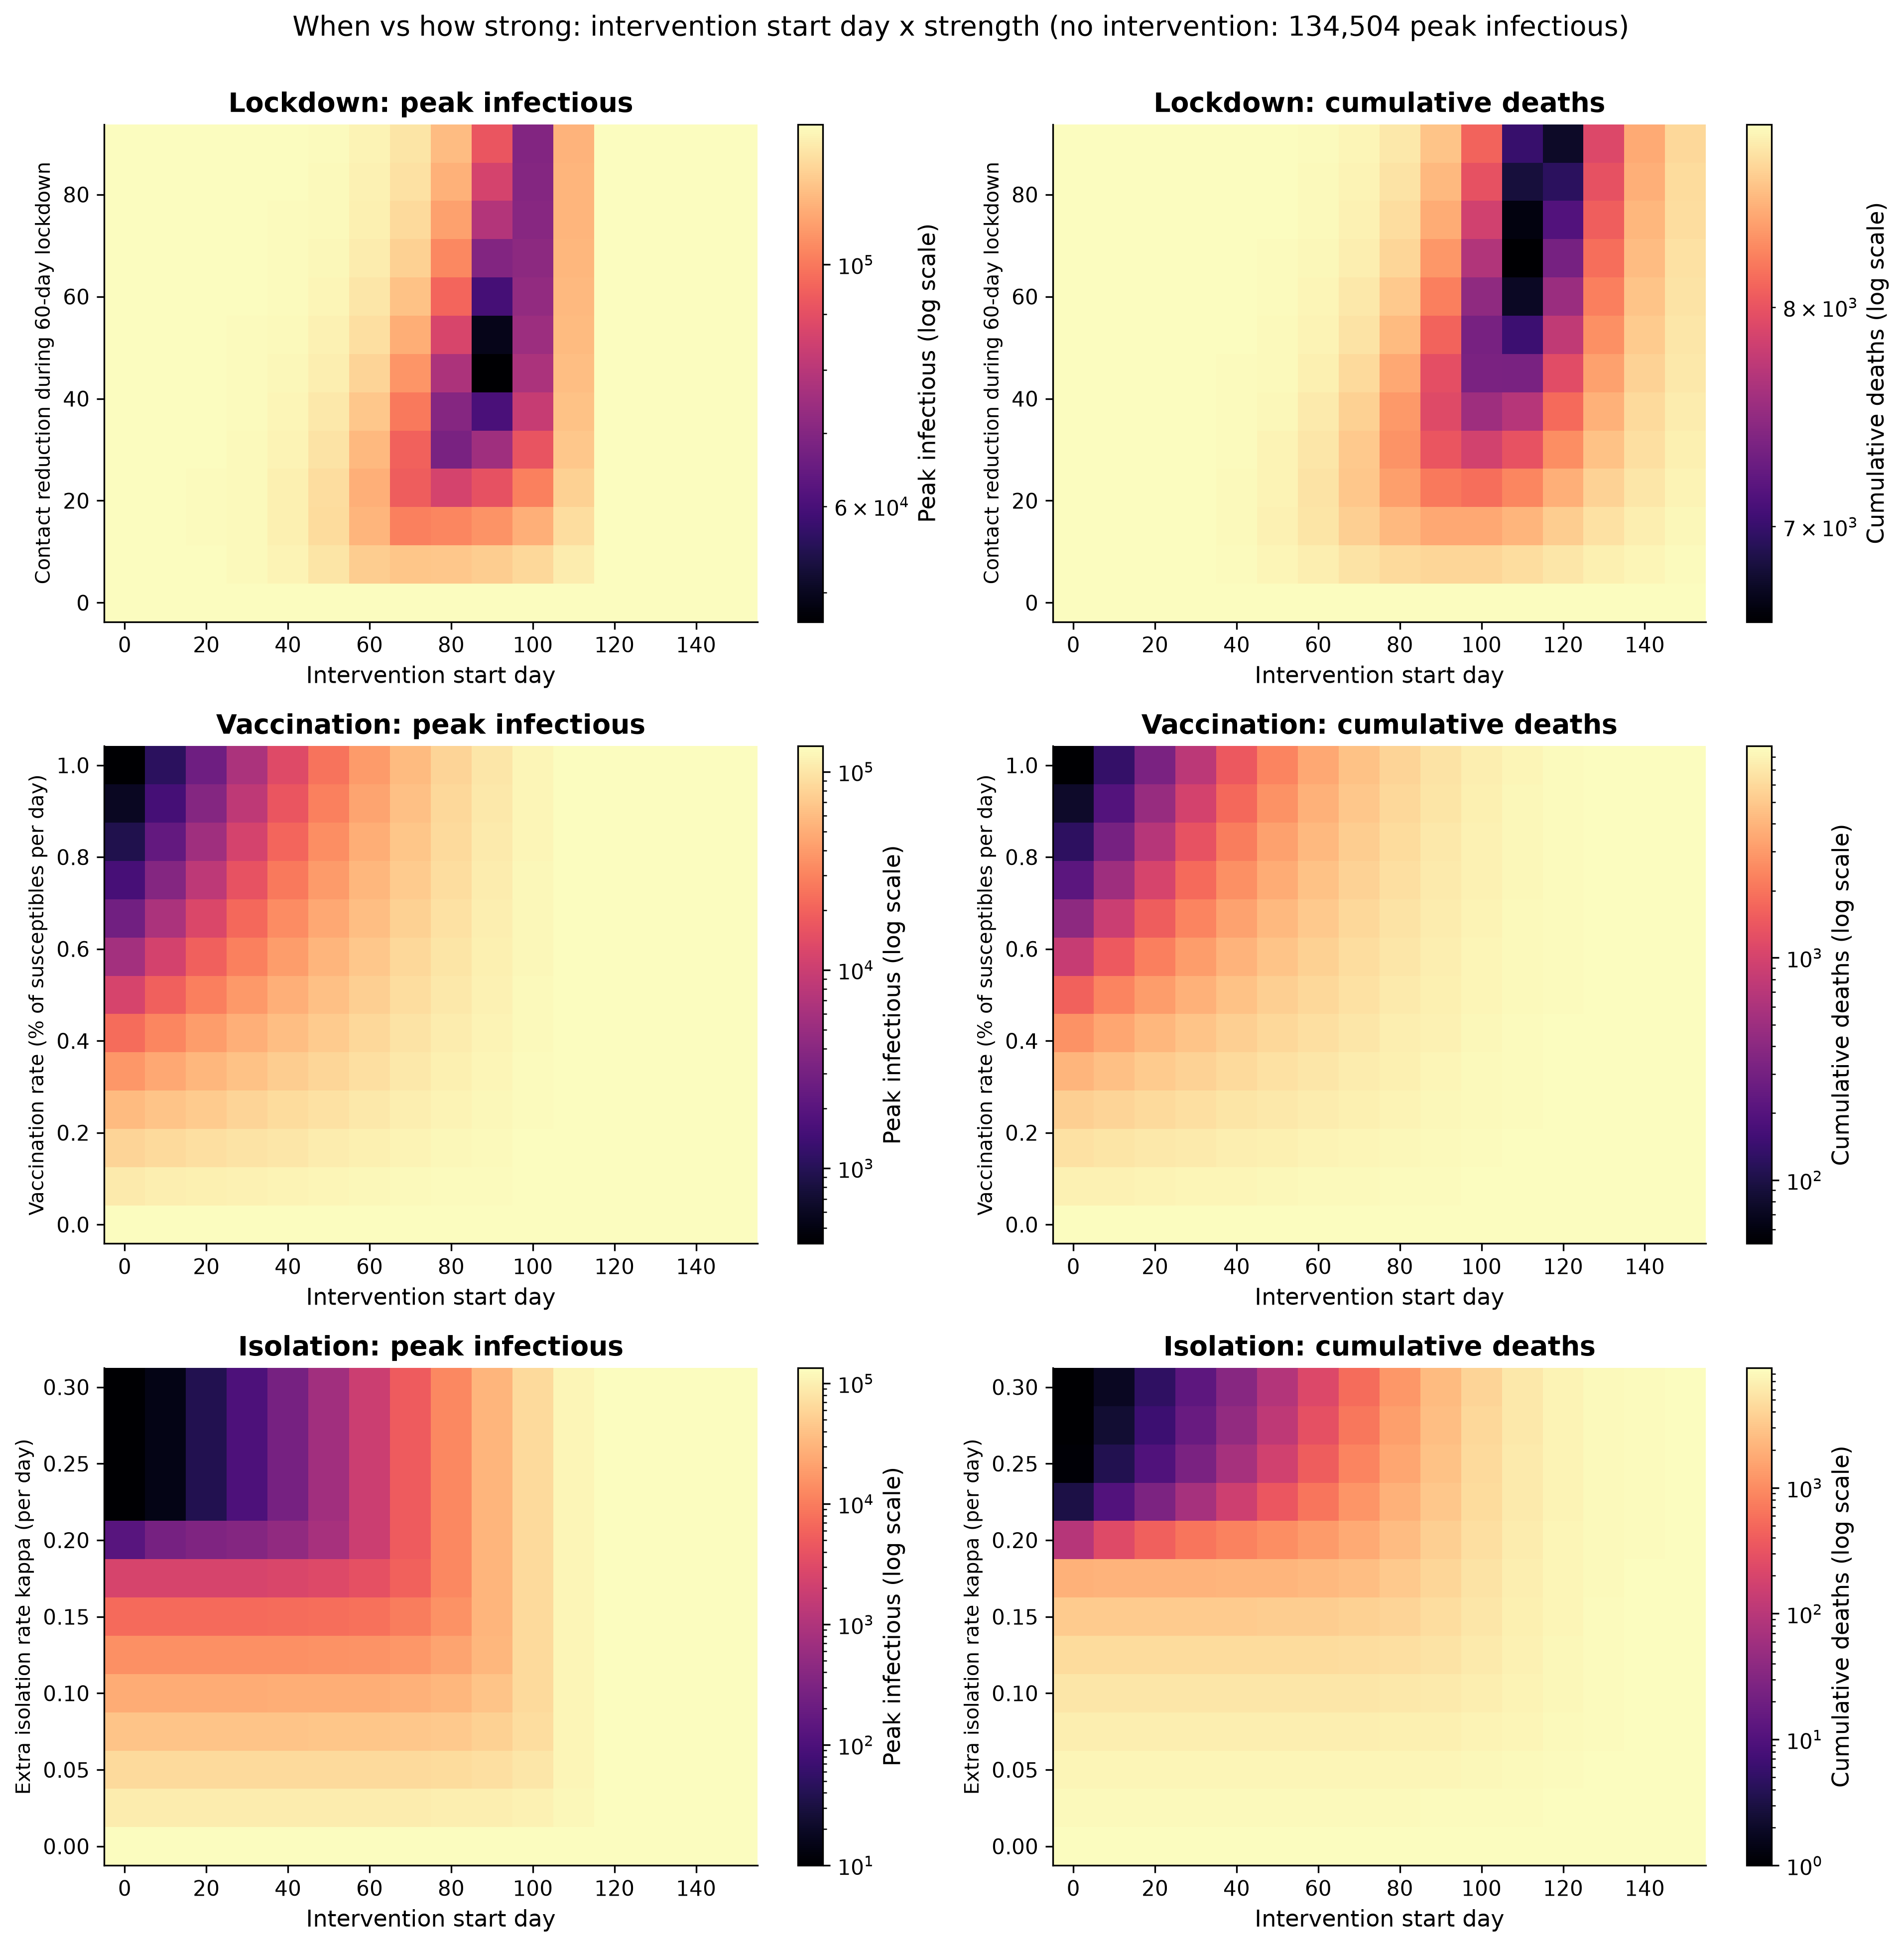
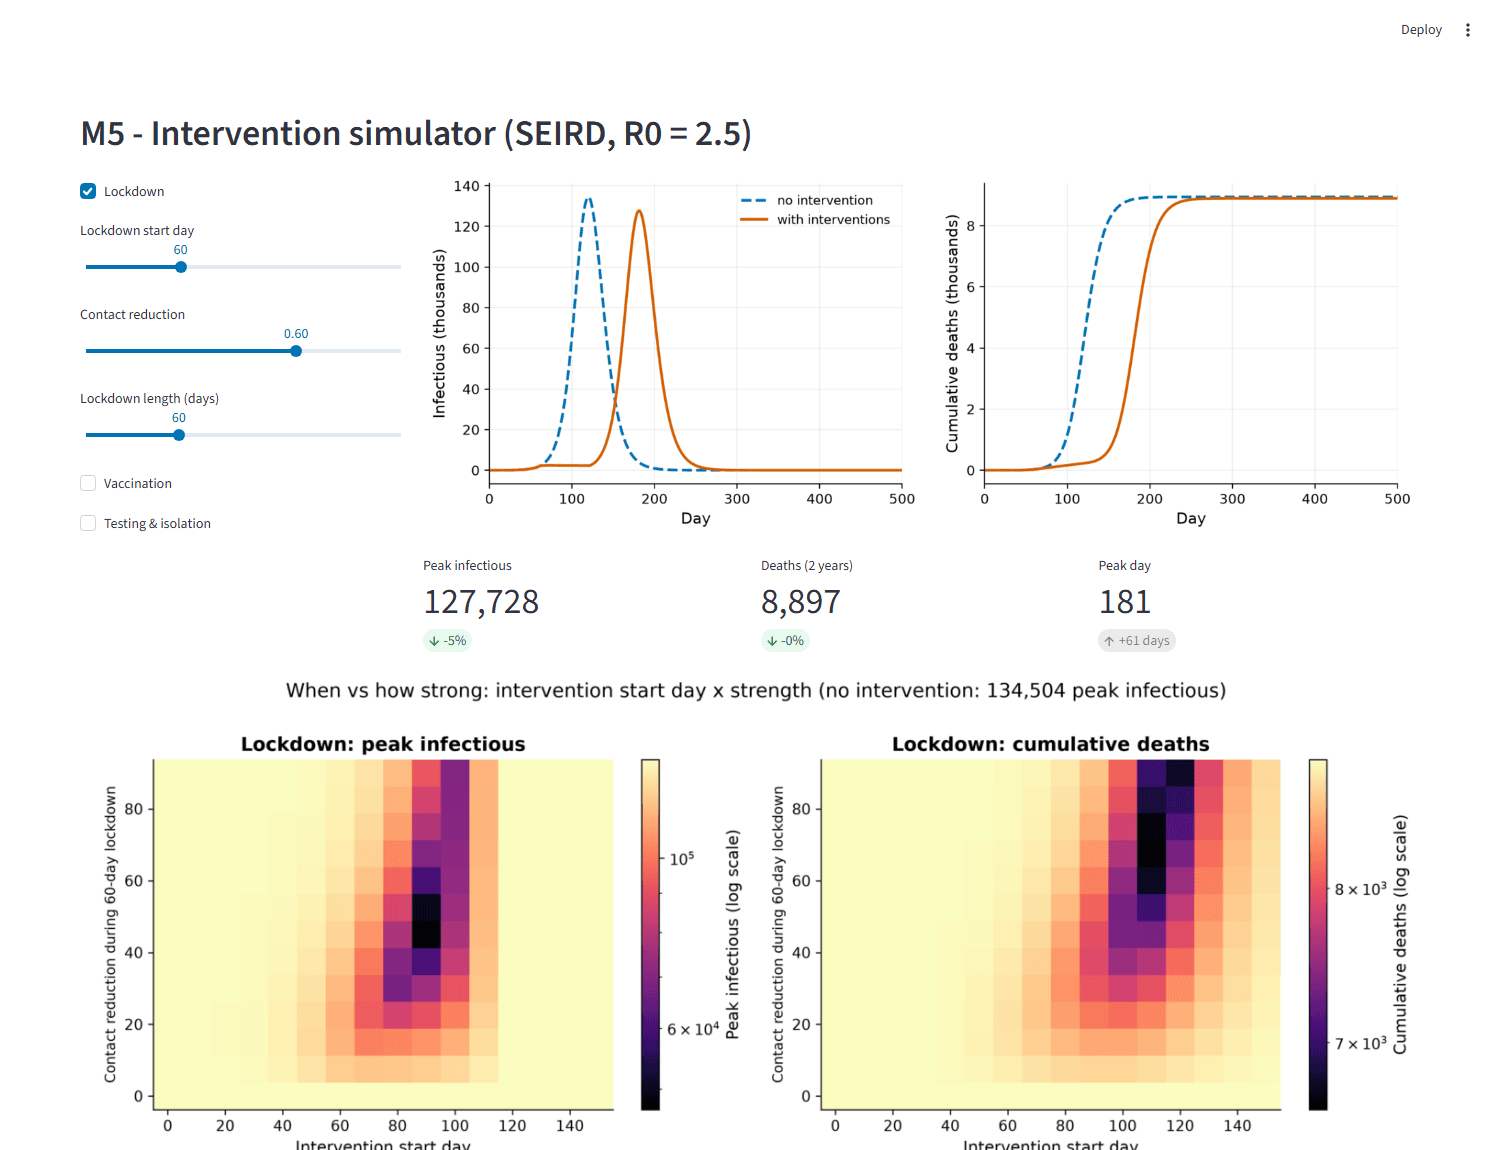
- M5 Interventions: lockdown, vaccination and test-and-isolate counterfactuals, with start-day × strength heatmaps.
- M6 Sensitivity: Latin hypercube sampling with partial rank correlation (PRCC).
- M7 Spatial: an 8-region metapopulation SEIR with a gravity-model travel matrix and an animated map.
- Extensions: a Bayesian fit with MCMC (emcee, negative-binomial likelihood) and an age-structured SEIR model with a contact matrix.
- Validation against analytical results, a pytest suite with CI, fixed seeds, and a Streamlit dashboard with live sliders for every module.
05Tools
- Python
- SciPy
- NetworkX
- emcee
- Streamlit
- pytest
06Visualizations
07Findings
- Real-data fit: 1978 boarding-school influenza outbreak, R0 = 3.93 (95% bootstrap CI 3.41–4.60), infectious period 2.0 days.
- Parameter recovery: on synthetic data with known truth, the fit recovers beta, gamma and R0 within 2.6%; the 95% CI for R0 contained the true value in 19 of 20 datasets (a small, suggestive check).
- Stochastic vs theory: simulated early-extinction probability 0.17 vs branching-process theory 0.16.
- Network structure: vaccinating the 10% best-connected nodes of a scale-free network cut the attack rate to 2.8%, vs 58.8% for random vaccination.
- Interventions: a 60-day lockdown alone averted 0.5% of deaths (it mostly delays the wave); combined with vaccination and isolation, 99.6%. Cutting travel by 90% delayed regional arrival by 13.6 days on average.
08Limitations
- Simplified educational models, not forecasting tools — nothing here should inform public-health, clinical or policy decisions.
- Homogeneous mixing within each compartment, network or region; no households, schools or workplaces.
- Constant parameters apart from explicit interventions: no seasonality, behaviour change, new variants or changes in testing.
- COVID-19 R0 values from early growth depend strongly on assumed latent and infectious periods; they only demonstrate the method.
- Vaccines are perfect and all-or-nothing; networks are synthetic and static; the spatial model uses a fictional map.