FIG. 02.1 — Project notes
- Independent
- Finished
Transcriptomic Profiling of Oral Squamous Cell Carcinoma
A reproducible reanalysis of paired tumor and normal RNA-seq from patients with oral squamous cell carcinoma, checked against an independent cohort and explorable in an interactive Streamlit app.
Exploratory research — no clinical claims
Exploratory associations from public data. These are not validated biomarkers, and the project makes no diagnostic or clinical claims.
- Up / down in tumor (discovery)
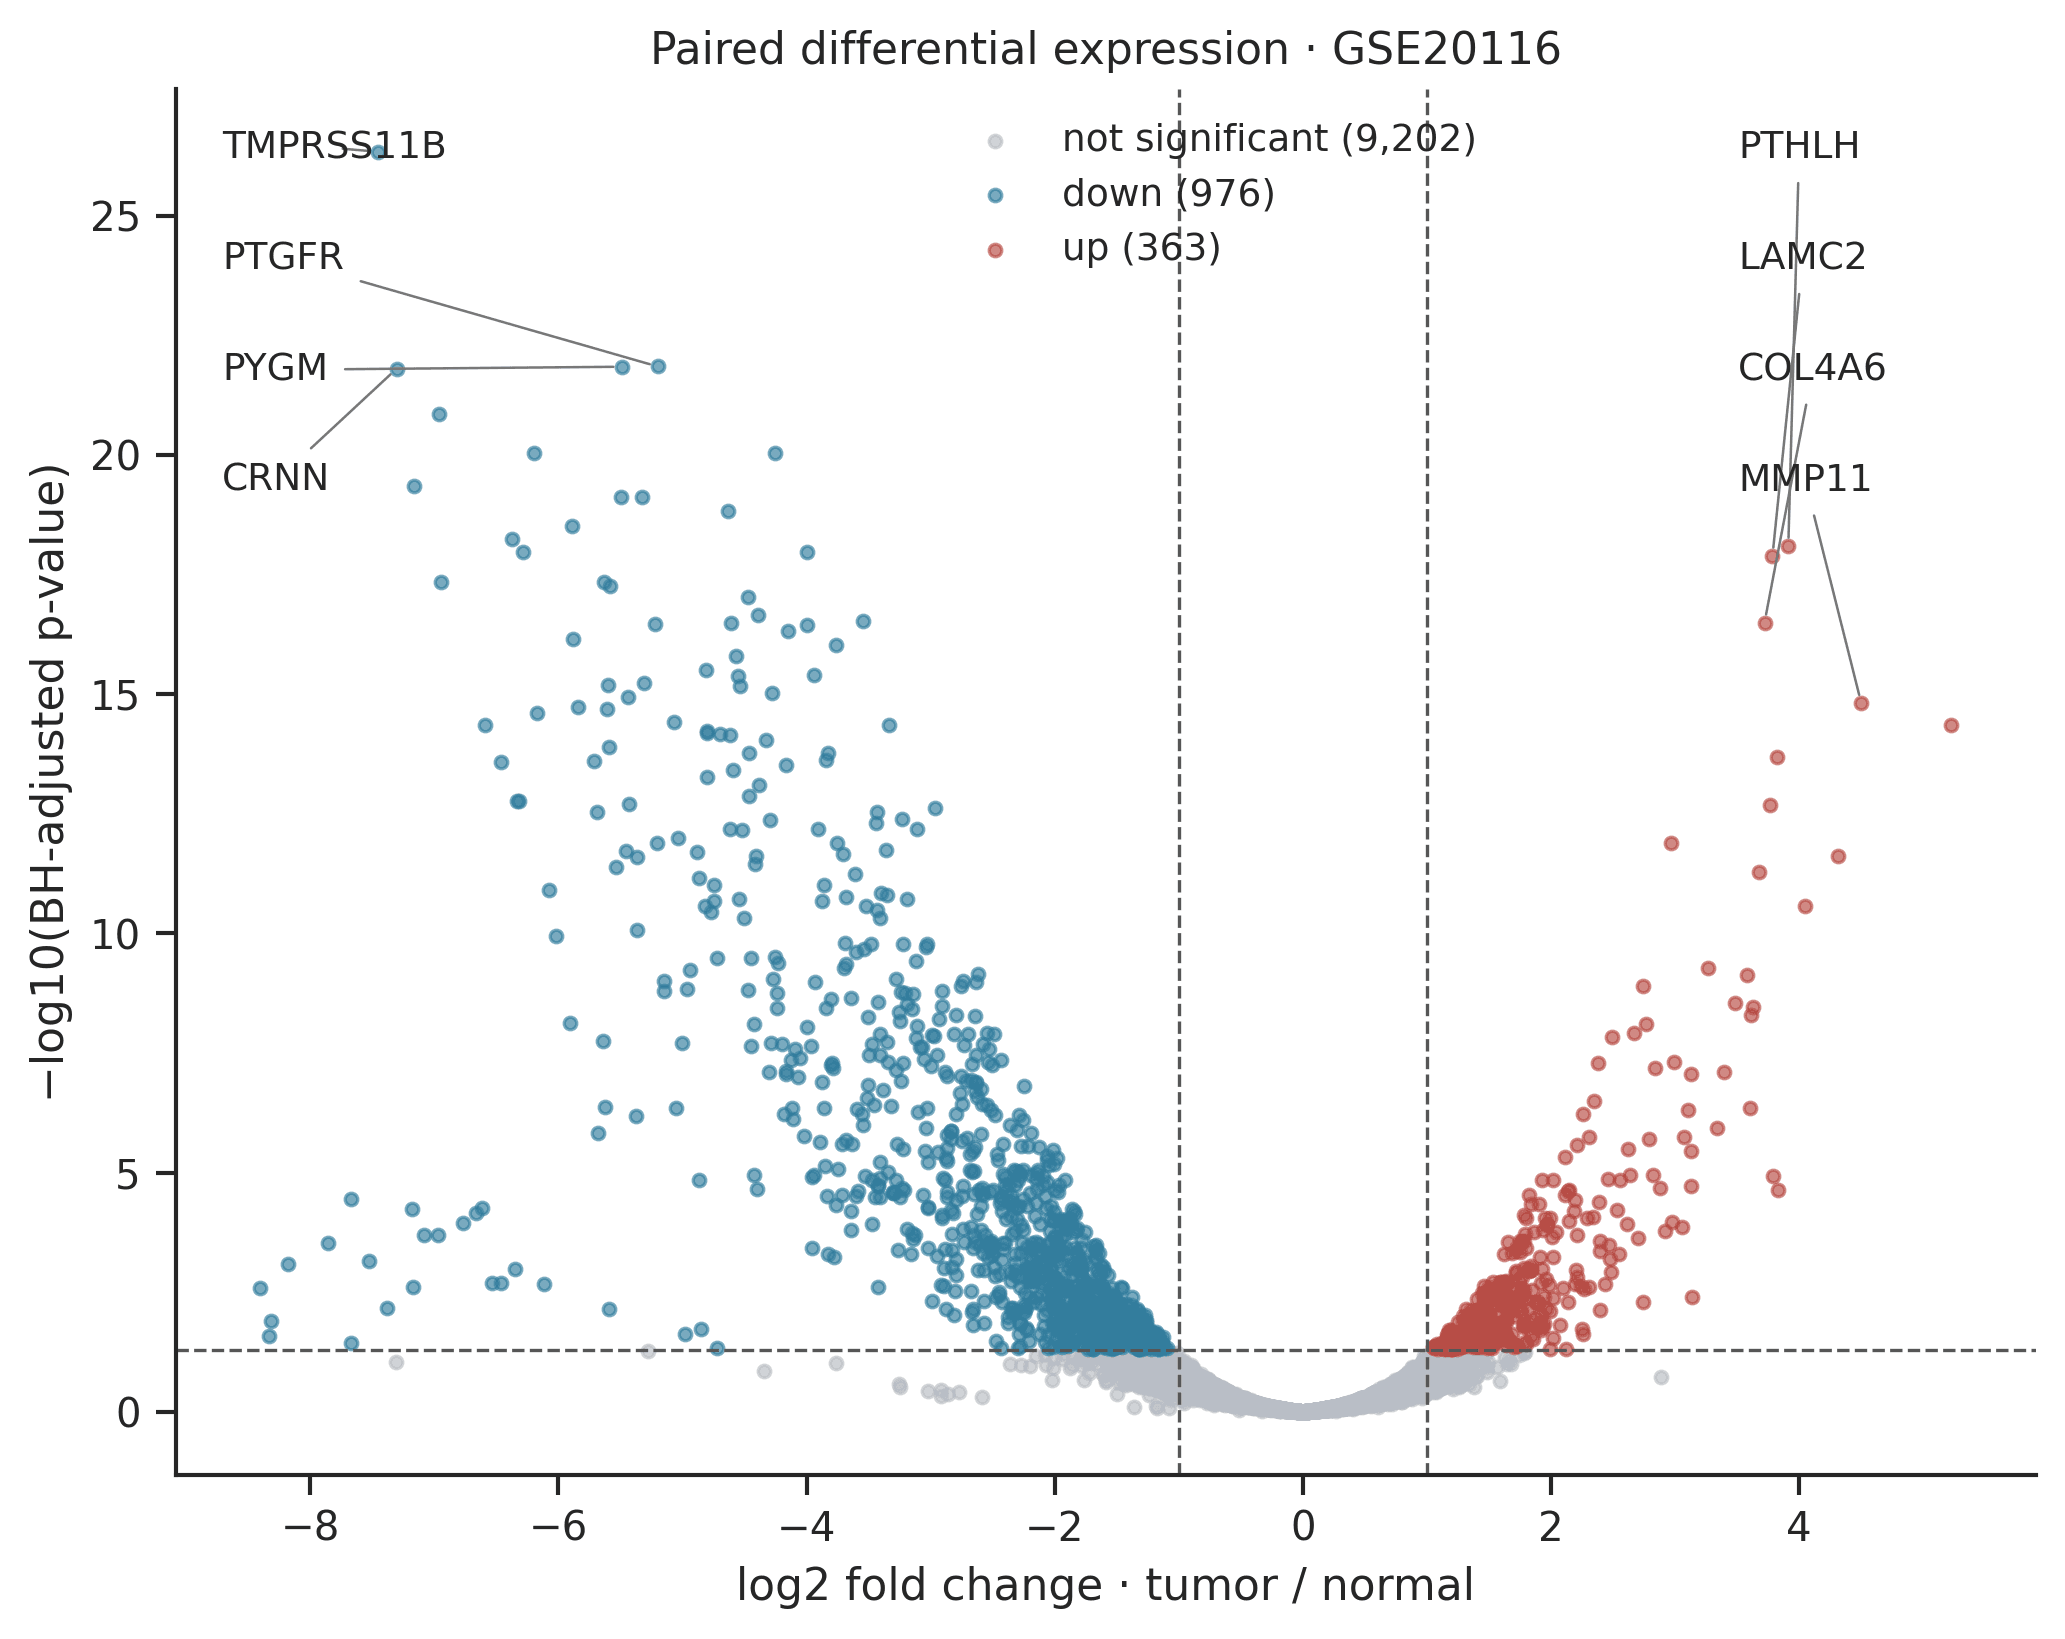
- 363 / 976
- Replicated in an independent cohort
- 706 of 1,339
- Matched tumor–normal pairs
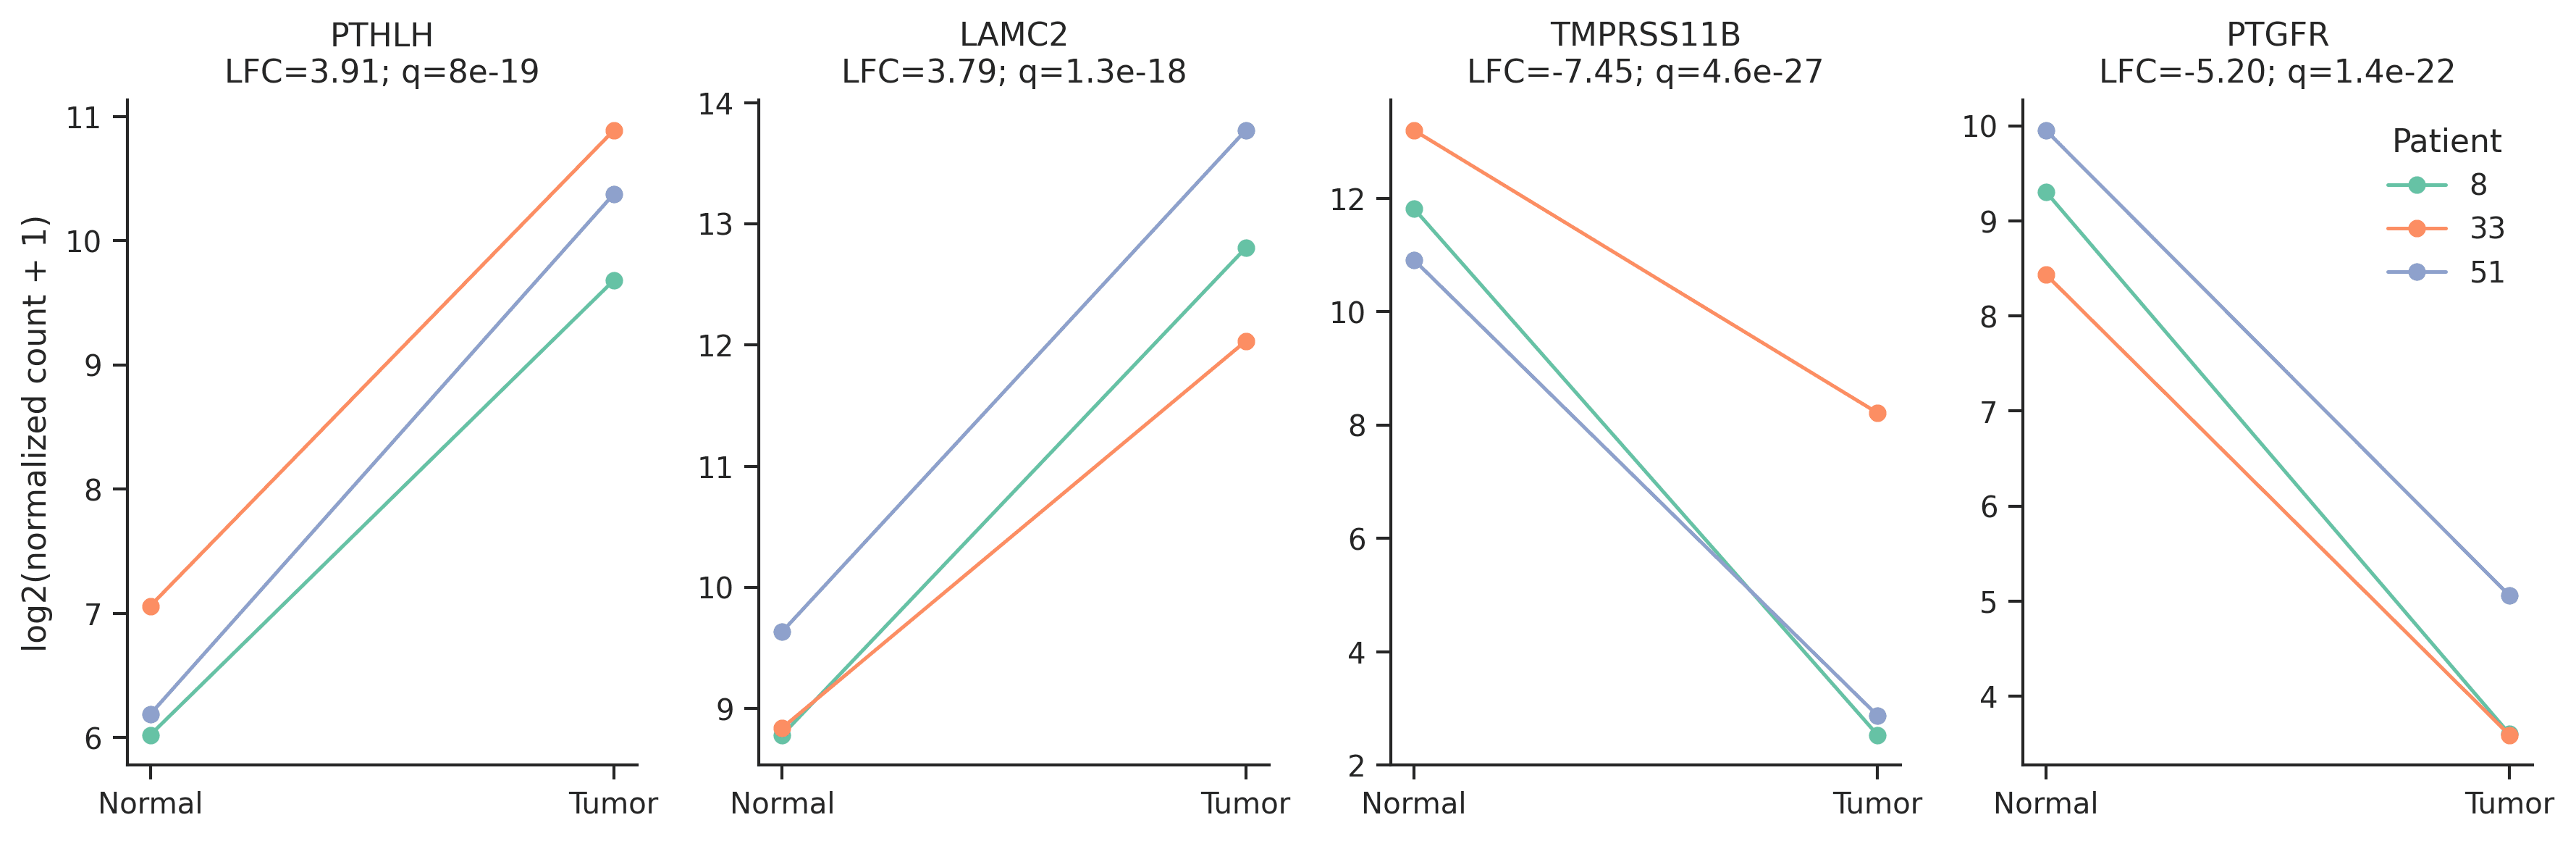
- 3 + 15
01Problem
Oral squamous cell carcinoma accounts for most oral cancers, and dental teams are often the first to see a suspicious lesion. This project asks what differs at the level of gene expression between OSCC and matched normal oral tissue from the same patients — and whether those differences hold up in a separate cohort.
02Question
Which gene representatives and pathways differ between OSCC and matched normal oral tissue?
03Data
Discovery: GEO GSE20116 — six RNA-seq samples from three matched patients, using the raw count columns from the original publication's supplementary table (Tuch et al., 2010). Validation: GEO GSE184616 — deposited raw gene counts for 15 matched tumor / adjacent-normal pairs from a separate, HPV-negative cohort.
04Methods
- Checked sample identities and patient pairing against GEO SOFT files, with checksum-locked downloads and a provenance manifest.
- Selected one gene representative per symbol, independently of fold changes, and filtered low expression (10,541 representatives retained).
- Paired PyDESeq2 negative-binomial model (~ patient_id + condition) with median-of-ratios normalization, convergence auditing and Benjamini–Hochberg correction.
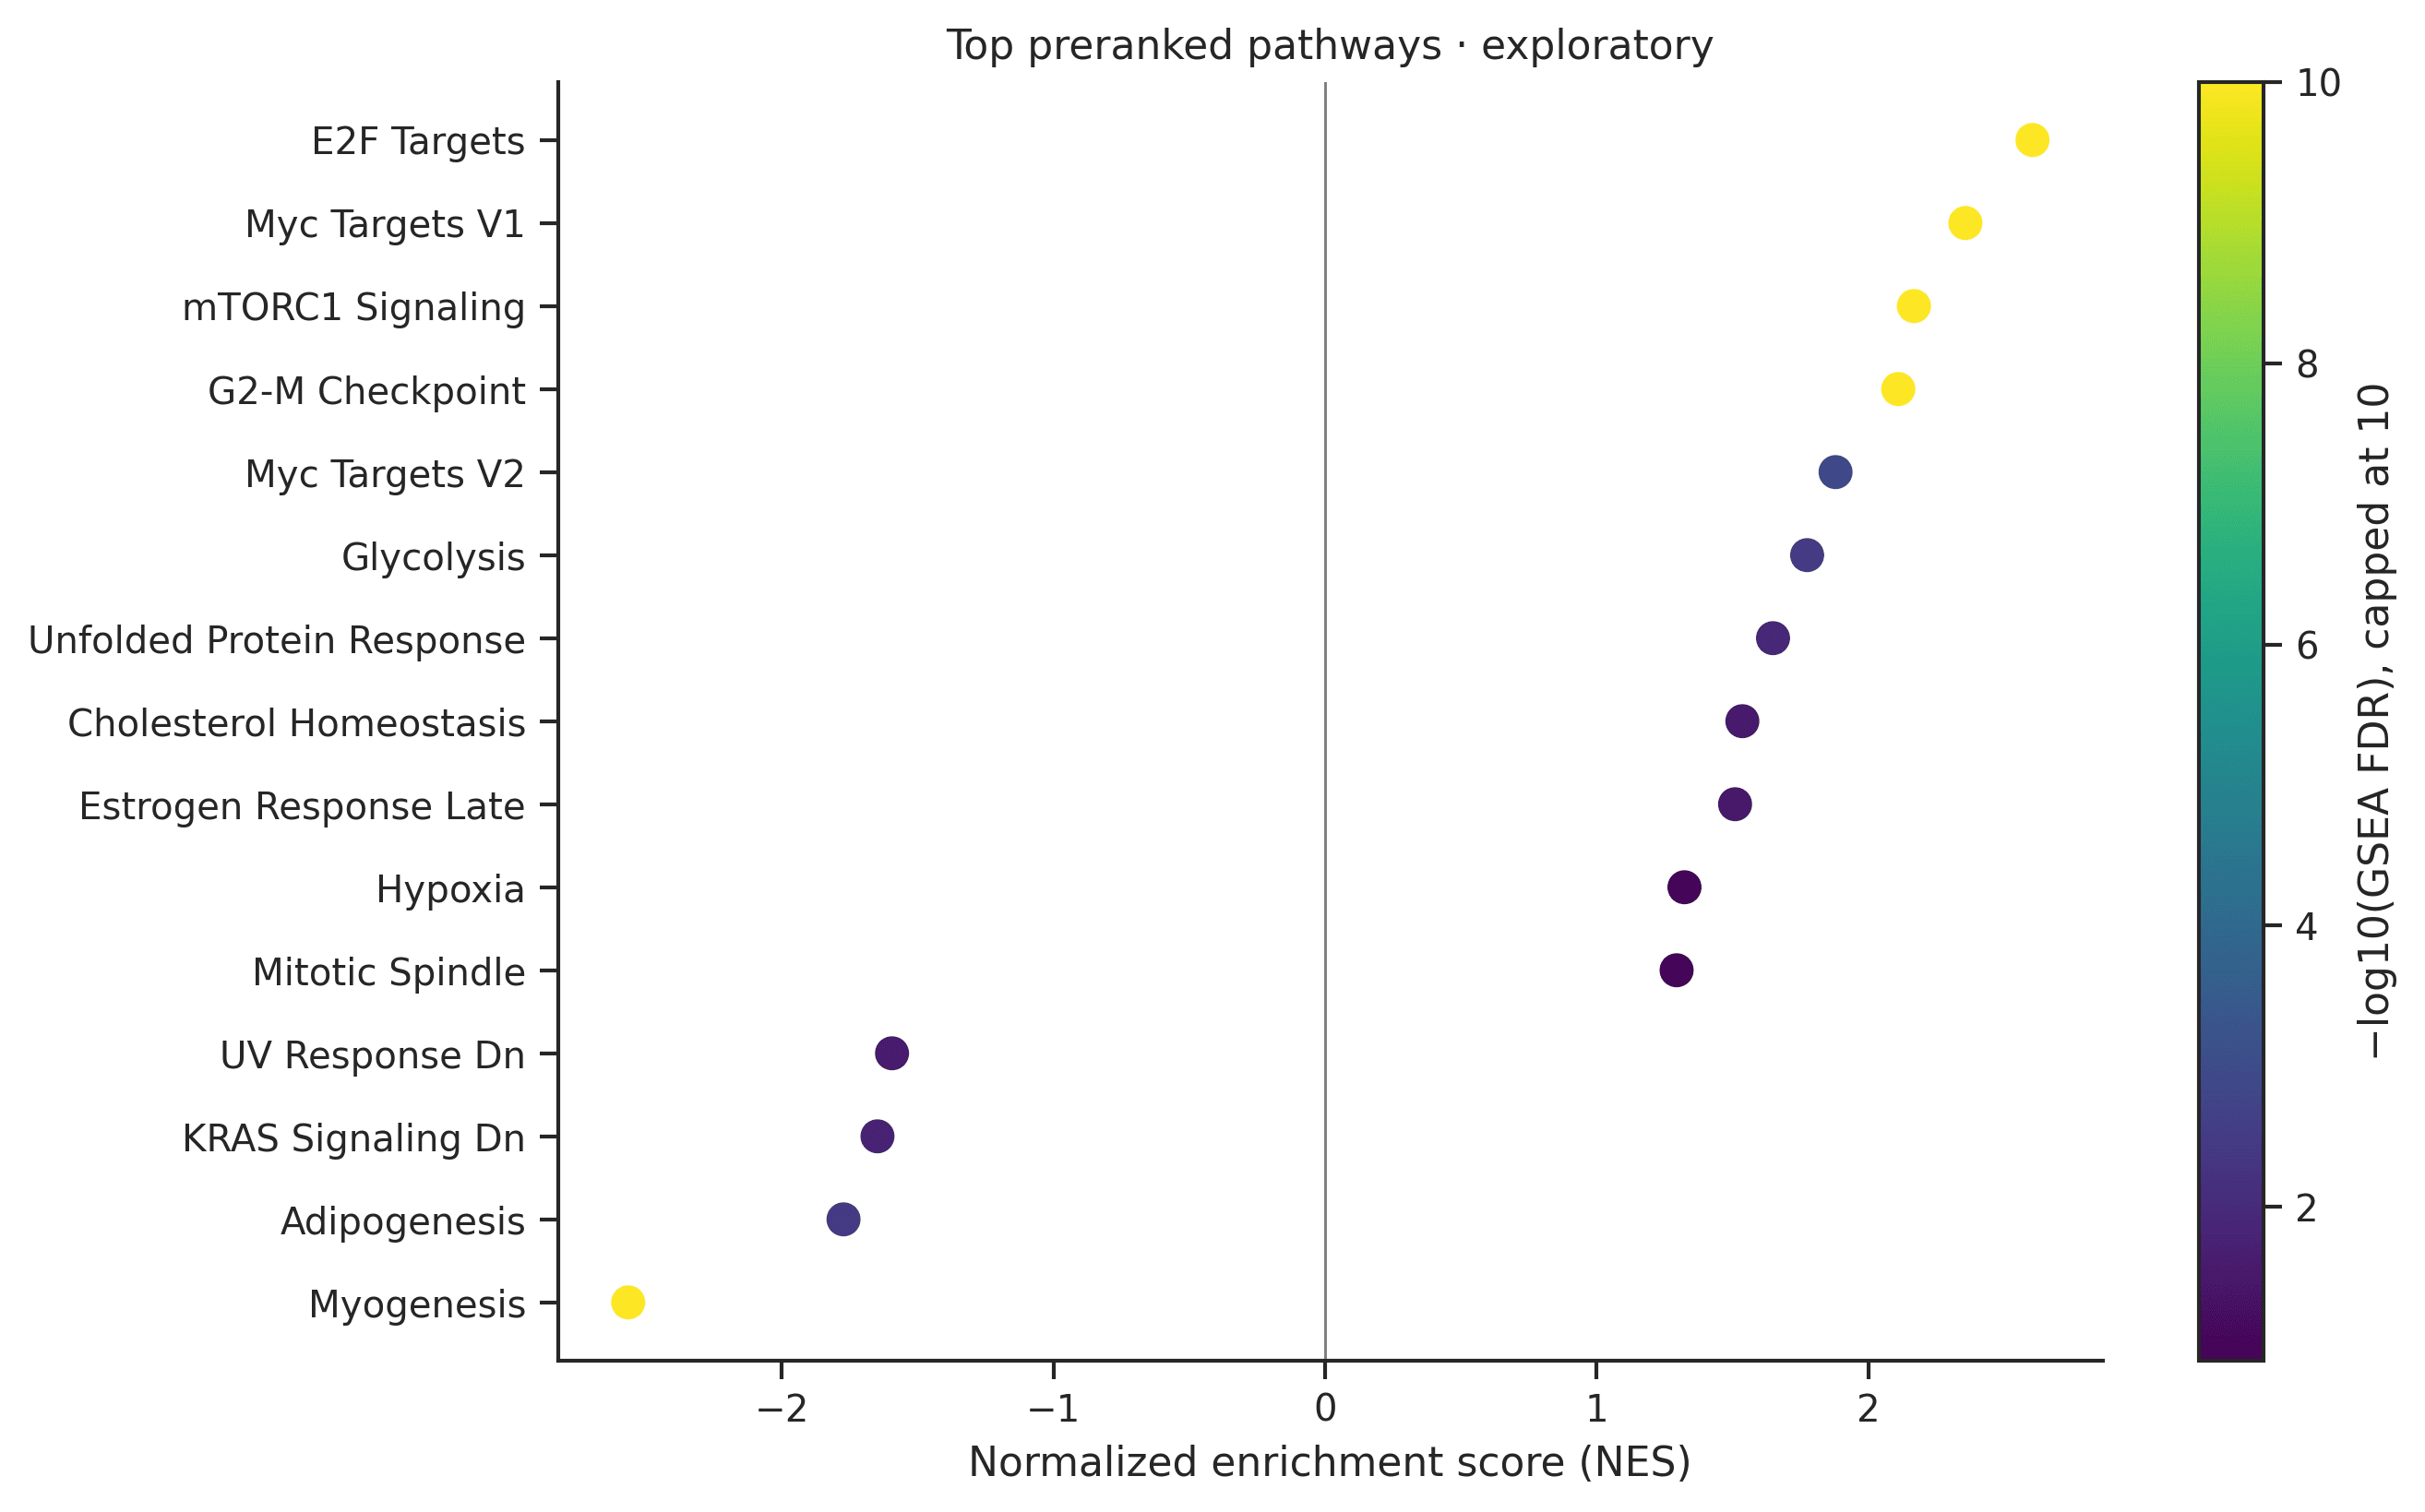
- Hallmark gene-set enrichment: preranked GSEA with GSEApy, plus over-representation analysis against the tested background.
- Independent validation: discovery candidates were frozen before fitting the same paired model to GSE184616 (15 pairs, 14 residual degrees of freedom).
- Publication figures, an executable notebook, automated tests, and a Streamlit / Plotly research explorer.
05Tools
- Python
- PyDESeq2
- GSEApy
- pandas
- Streamlit
- Plotly
- pytest
06Visualizations
07Findings
- Discovery (q < 0.05, |log2 fold change| > 1): 363 upregulated and 976 downregulated gene representatives out of 10,541; 35 features were excluded after an optimizer convergence failure.
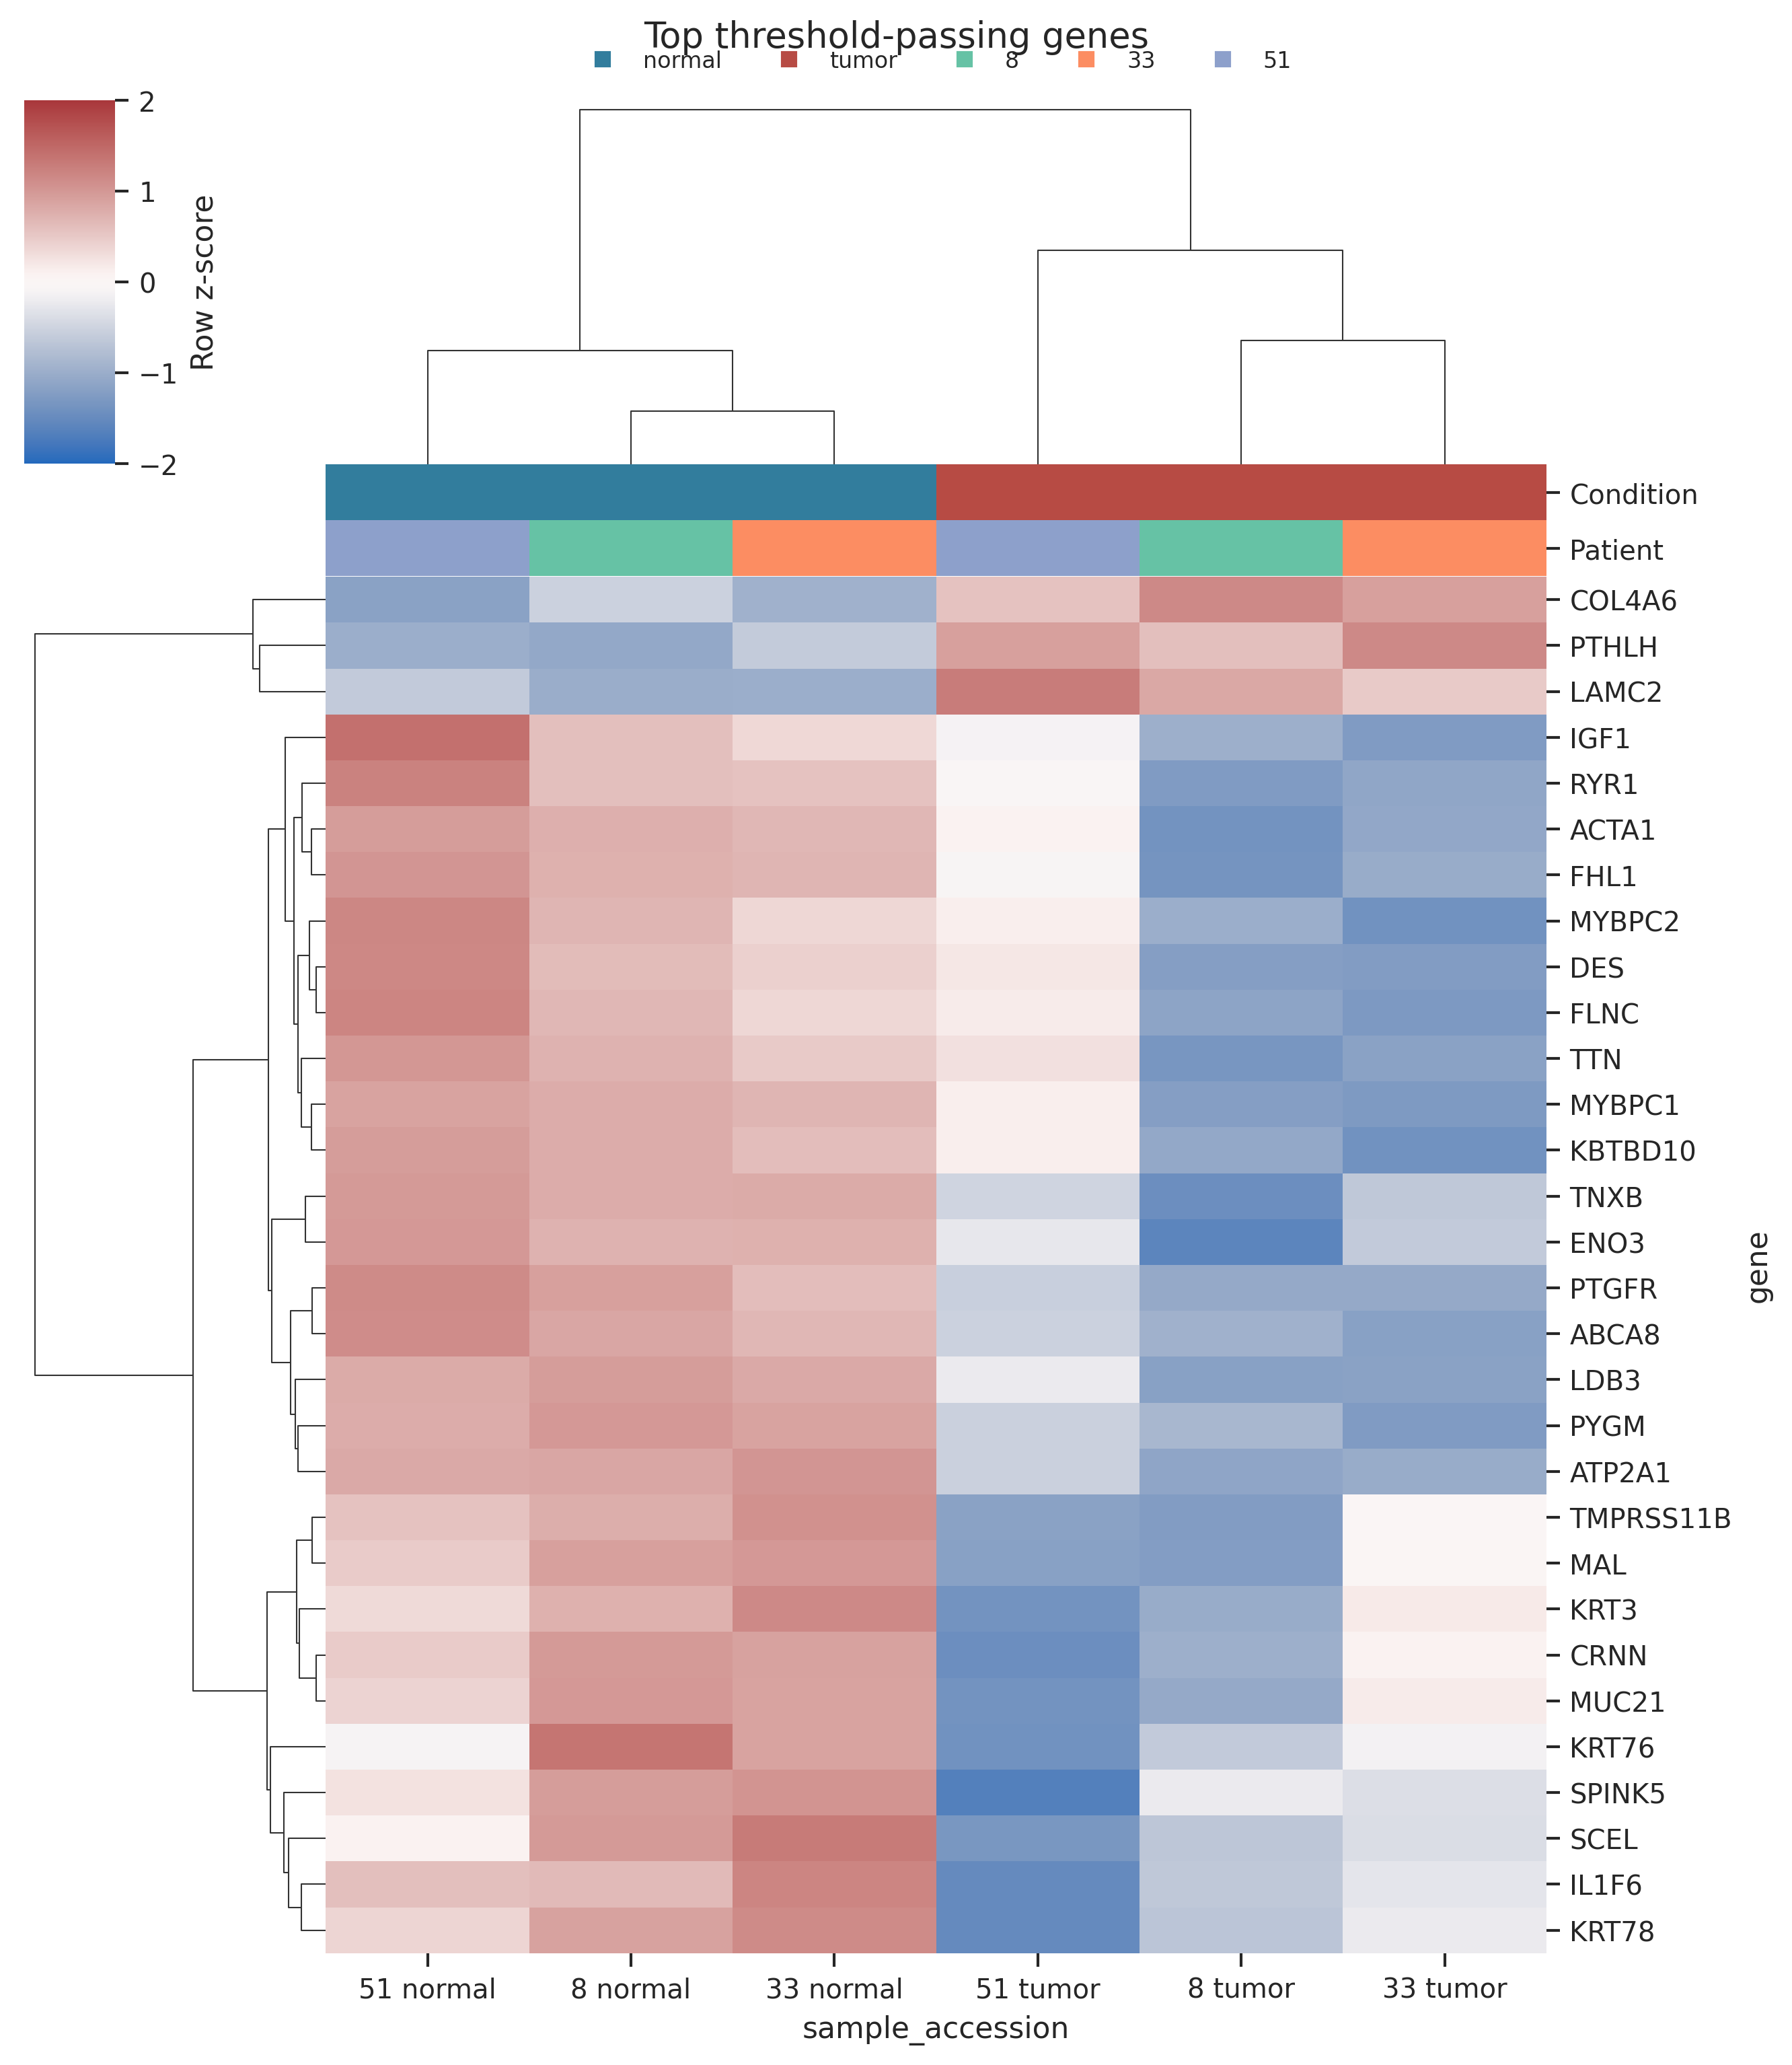
- Leading upregulated representatives include PTHLH, LAMC2 and COL4A6; leading downregulated include TMPRSS11B, PTGFR and PYGM.
- Hallmark GSEA placed E2F Targets toward tumor (NES 2.61) and Myogenesis toward normal tissue (NES −2.57).
- Independent cohort (GSE184616): 1,187 of 1,339 frozen candidates were testable; 964 had the same direction (81.2%) and 706 replicated at genome-wide q < 0.05.
08Limitations
- Three discovery patients leave only two residual degrees of freedom, so dispersion estimates are uncertain.
- Historical SOLiD / hg18 processing and older gene symbols limit coverage; discovery and validation use different quantification units.
- Tumor heterogeneity, tissue composition and field effects in normal margins can drive expression differences.
- This replicates differential-expression associations — it is not a diagnostic classifier, prognostic model, causal mechanism or validated biomarker.
- No qPCR or wet-lab confirmation was performed.